
Blog
Liquidation Pallet Categories: Which Ones Are Most Profitable?


Choosing the right Liquidation Pallet Categories can make a major difference in how quickly you recover your investment, how much time you spend processing inventory, and how much profit you ultimately keep.
We’ve sourced over 1,000 liquidation pallets in the last 18 months. Every pallet was tracked, profit margins were calculated, and hourly rates were documented.
The data tells a story that contradicts much of what you read online.
Many resellers assume that the highest percentage margin automatically means the most profit. But that’s not always true. A 150% margin can look incredible until you discover that you’re selling only two items per week and have thousands of dollars tied up in inventory.
The better question is:
“Which liquidation pallet category gives me the best combination of hourly income, sell-through speed, profit, and manageable capital requirements?”
That’s a completely different way to evaluate Liquidation Pallet Categories.
In this guide, we’ll compare four major categories:
You’ll learn how each category compares in terms of margins, sell-through, hourly rate, risk, capital requirements, and resale opportunities.
The Data: 1,000+ Liquidation Pallets Tracked
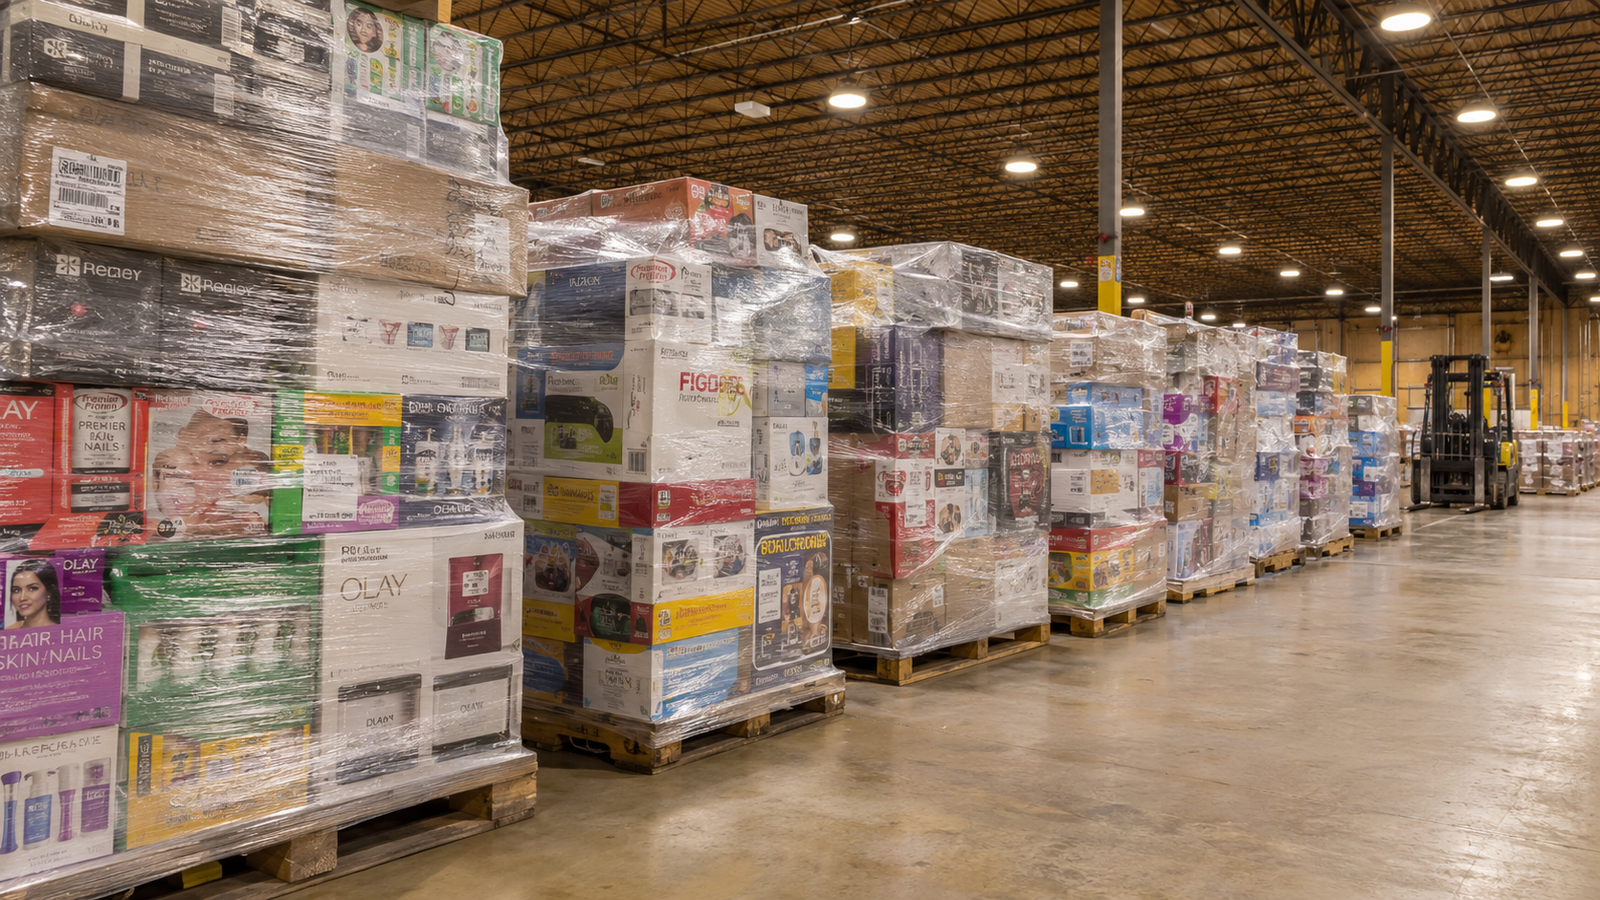
Over 18 months, the source data tracked:
- 1,247 liquidation pallets
- 4 major categories: Electronics, Tools, Clothing, and Cosmetics
- 6 resale platforms: eBay, Amazon FBA, Mercari, Facebook Marketplace, local, and international
- $1.8M+ total inventory value
- $3.2M+ total resale revenue
- 58% average blended margin
However, the performance of individual Liquidation Pallet Categories varies significantly.
That’s where the real opportunity—and the real decision-making—begins.
Liquidation Pallet Categories Ranked by Hourly Rate
Instead of ranking pallets solely by percentage margin, this guide considers:
- Profit margin
- Sell-through speed
- Hourly earning potential
- Capital requirements
- Learning curve
- Risk
- Resale opportunities
Tier 1: Electronics 🏆
Average profit margin: 48–62%
Average sell-through: 7–14 days
Average hourly rate: $24–32/hour
Capital efficiency: High
Learning curve: Medium
Electronics ranks among the strongest Liquidation Pallet Categories because resellers can access several selling channels while benefiting from strong demand for recognizable brands.
Why Electronics Perform Well
Electronics have three major advantages:
- Multiple resale channels — eBay, Amazon FBA, Mercari, Facebook Marketplace, and international markets.
- Fast capital turnover — inventory can potentially sell within days rather than sitting for months.
- Recognizable brands — Apple, Samsung, HP, and Sony have established consumer demand.
Example: $1,500 Electronics Pallet
| Metric | Example |
|---|---|
| Pallet cost | $1,500 |
| Shipping | $300 |
| Total invested | $1,800 |
| Total resale revenue | $2,100 |
| Platform fees/returns | -$300 |
| Supplies/storage | -$130 |
| Net profit | $770 |
| Time invested | 28 hours |
| Hourly rate | $27.50/hour |
| Timeline | 10 days |
Based on the source example, an organized reseller could potentially process several electronics pallets per month, although actual results will vary by inventory quality, marketplace, fees, demand, and selling ability.
Best Platforms for Electronics
- eBay — Large audience for technology
- Amazon FBA — Useful for eligible inventory
- Mercari — Another option for mid-range electronics
Risk Level: Medium
Potential challenges include:
- Authenticity verification
- Defective or DOA products
- Customer returns
- Testing requirements
Who Should Choose Electronics?
Electronics may be a strong option for:
- Established eBay or Amazon sellers
- Resellers willing to test devices
- People who want multiple selling channels
- Resellers focused on faster capital turnover
Tier 2: Tools 🔧
Average profit margin: 42–58%
Average sell-through: 10–21 days
Average hourly rate: $22–28/hour
Capital efficiency: High
Learning curve: Low
Tools are another attractive option among Liquidation Pallet Categories, especially for resellers who want to develop local or wholesale relationships.
Why Tools Are a Strong Category
The biggest advantage of tool pallets is their potential for B2B sales.
Once you’ve sourced several pallets, you may be able to develop relationships with:
- Contractors
- Construction companies
- Tool rental businesses
- Local tradespeople
- Wholesale buyers
This can reduce the amount of time you spend creating individual listings.
Example: $1,500 Tool Pallet
| Metric | Example |
|---|---|
| Pallet cost | $1,500 |
| Shipping | $250 |
| Total invested | $1,750 |
| Total resale revenue | $2,200 |
| Platform fees/returns | -$220 |
| Supplies/storage | -$100 |
| Net profit | $680 |
| Time invested | 32 hours |
| Hourly rate | $21.25/hour |
| Timeline | 16 days |
The Wholesale Advantage
After establishing a consistent supply, you could approach local contractors with an offer such as:
“I source DEWALT and Milwaukee inventory regularly. Would you be interested in purchasing multiple units at a wholesale price?”
Wholesale can provide:
- Higher-volume transactions
- Less individual listing work
- Faster inventory movement
- Repeat customers
Best Platforms for Tools
- eBay
- Facebook Marketplace
- Direct wholesale
Risk Level: Low
Compared with some other Liquidation Pallet Categories, tools can be relatively straightforward to inspect.
Potential advantages include:
- Lower counterfeiting concerns
- Fewer complicated defects
- Easier condition assessment
- Potentially lower return rates
Who Should Choose Tools?
Tools can work well for:
- Resellers located near construction businesses
- People interested in B2B relationships
- Sellers comfortable with moderate sell-through times
- Beginners looking for a simpler category
Tier 2B: Clothing 👕
Average profit margin: 85–145%
Average sell-through: 10–21 days
Average hourly rate: $18–26/hour
Capital efficiency: Medium
Learning curve: Low-Medium
Clothing has some of the highest visible margins among these Liquidation Pallet Categories, but percentage margin alone doesn’t tell the entire story.
Why Clothing Margins Can Be Misleading
A $1,000 clothing pallet may potentially resell for $2,200–$2,800.
That looks excellent on paper.
However, clothing often requires:
- More photography
- Size measurements
- Detailed descriptions
- Individual listings
- More customer questions
- Potential returns due to sizing and fit
Example: $1,000 Clothing Pallet
| Metric | Example |
|---|---|
| Pallet cost | $1,000 |
| Shipping | $200 |
| Total invested | $1,200 |
| Total resale revenue | $2,100 |
| Platform fees | -$420 |
| Returns/refunds | -$210 |
| Supplies/storage | -$80 |
| Net profit | $590 |
| Time invested | 35 hours |
| Hourly rate | $16.86/hour |
| Timeline | 21 days |
Why the Hourly Rate Can Be Lower
The source data identifies several factors:
- Photography can take considerable time.
- Sell-through can be slower.
- Sizing creates return risk.
- Marketplace fees can reduce margins.
Best Platforms for Clothing
- Poshmark
- Mercari
- eBay
How to Improve Clothing Resale Results
Try:
- Batch photography
- Listing templates
- Focusing on recognizable brands
- Competitive pricing
- Standardized measurements
The source specifically highlights brands such as Nike, Lululemon, and Gymshark as examples of products that may benefit from strong demand.
Tier 1B: Cosmetics 💄
Average profit margin: 92–168%
Average sell-through: 7–14 days
Average hourly rate: $20–29/hour
Capital efficiency: Very High
Learning curve: Medium-High
Cosmetics can be one of the most interesting Liquidation Pallet Categories because the combination of high margins, relatively fast sell-through, and lower photography requirements can create attractive hourly economics.
Why Cosmetics Can Perform Well
Cosmetics may offer:
- High potential margins
- Fast-moving products
- Multiple resale channels
- Less photography than clothing
- Relatively low starting capital
Example: $1,000 Cosmetics Pallet
| Metric | Example |
|---|---|
| Pallet cost | $1,000 |
| Shipping | $250 |
| Total invested | $1,250 |
| Total resale revenue | $2,250 |
| Platform fees/returns | -$225 |
| Supplies/storage | -$75 |
| Net profit | $700 |
| Time invested | 24 hours |
| Hourly rate | $29.17/hour |
| Timeline | 9 days |
Why Cosmetics Can Have Strong Hourly Economics
The source highlights:
- Less photography compared with clothing
- Potentially fast sell-through
- High potential margins
- Less technical testing than electronics
However, cosmetics still require careful attention to authenticity, product condition, expiration information, and applicable regulations.
Best Platforms for Cosmetics
- Mercari
- eBay
- Amazon
- Local beauty shops
Risk Level: Medium-High
Important considerations include:
- Counterfeit products
- Expiration dates
- Batch codes
- Applicable cosmetic regulations
Who Should Choose Cosmetics?
Cosmetics may be suitable for:
- Beauty enthusiasts
- Experienced brand researchers
- Resellers comfortable with authenticity checks
- Sellers with an established beauty audience
Liquidation Pallet Categories Compared Side by Side
Here’s a quick comparison of the four categories in the source data:
| Category | Margin | Sell-Through | Hourly Rate | Capital Needed | Complexity |
|---|---|---|---|---|---|
| Electronics | 48–62% | 7–14 days | $24–32/hr | $1,500–2,000 | Medium |
| Tools | 42–58% | 10–21 days | $22–28/hr | $1,500–2,000 | Low |
| Clothing | 85–145% | 10–21 days | $16–26/hr | $1,000–1,500 | Medium |
| Cosmetics | 92–168% | 7–14 days | $20–29/hr | $1,000–1,500 | Medium-High |
Important: These figures come from the supplied source and should be treated as example historical data rather than guaranteed future performance.
Seasonal Trends Across Liquidation Pallet Categories

Seasonality can change demand, pricing, and sell-through.
January–March: Q1
Best categories: Electronics and Tools
Electronics can benefit from New Year technology purchases, while tools can benefit from spring-project preparation.
Slower category: Clothing
April–June: Q2
Best categories: Clothing and Tools
Spring and summer clothing demand can increase, while outdoor projects can create demand for tools.
July–September: Q3
Best categories: Electronics and Clothing
Back-to-school demand can increase interest in laptops and other electronics, while consumers refresh their wardrobes.
October–December: Q4
Best categories: Cosmetics and Electronics
Holiday shopping can create strong demand across multiple categories, including beauty products, electronics, clothing, and tools.
Seasonal planning is therefore an important part of evaluating Liquidation Pallet Categories rather than treating every month as identical.
How to Choose the Right Liquidation Pallet Category for You
There isn’t one category that works for every reseller.
The best choice depends on your platform, budget, skills, audience, and available time.
Already Have an eBay Account?
Consider Electronics.
Already Sell on Amazon?
Consider Electronics, provided your inventory meets Amazon’s requirements.
Have an Established Poshmark Audience?
Consider Clothing.
Already Have a Mercari Audience?
Consider Cosmetics or Electronics.
Have Contractor Connections?
Consider Tools.
Completely New to Reselling?
The source recommends starting with Electronics because of its broad audience and potential for multiple sales channels.
Want to Prioritize Hourly Rate?
Consider Cosmetics or Electronics based on the source’s reported figures.
Want Simpler Inventory?
Tools may be a better starting point because the learning curve and sourcing complexity are lower.
Want High Percentage Margins?
Clothing and Cosmetics show the highest reported margins in the supplied data, although their hourly rates and operational requirements differ.
The Hidden Variable: Timing Your Purchases
One factor that’s often overlooked when comparing Liquidation Pallet Categories is timing.
Buying at the right time can give you an opportunity to purchase inventory during slower periods and sell when demand increases.
Examples from the source include:
- January purchase → March selling period
- May purchase → July back-to-school period
- August purchase → September–October demand
- September purchase → November holiday season
Example: Clothing
The source provides an example comparing a $1,000 clothing pallet purchased during different periods. The reported resale outcomes vary depending on when the inventory is purchased and sold.
The takeaway is simple:
Timing can influence profit just as much as category selection.
The 5-Step Liquidation Pallet Category Decision Framework
Before buying, ask yourself five questions.
1. Which Platform Do I Already Have?
- eBay → Electronics
- Amazon → Electronics
- Poshmark → Clothing
- Mercari → Cosmetics or Electronics
2. How Much Capital Do I Have?
- $500–$1,000: Clothing or Cosmetics
- $1,500+: Electronics or Tools
3. How Much Time Can I Invest?
- 5–10 hours/week: Electronics
- 10–20 hours/week: Clothing or Cosmetics
- 5–15 hours/week with wholesale potential: Tools
4. What’s My Experience Level?
- Beginner: Tools
- Intermediate: Electronics or Clothing
- Advanced: Cosmetics
5. What Do I Want to Optimize?
- Hourly rate: Cosmetics or Electronics
- Margins: Clothing or Cosmetics
- Simplicity: Tools
- Speed: Electronics
This framework makes comparing Liquidation Pallet Categories much easier because you’re choosing based on your actual business situation rather than simply chasing the highest percentage.
Real-World Liquidation Pallet Scenarios
Scenario 1: You’re Starting From Scratch
Recommended category: Electronics
Why?
- Large potential audience
- Multiple platforms
- Moderate learning curve
- Fast potential capital turnover
Example budget: $1,500–$2,000 per pallet
Source example timeline: 3–4 weeks
Source example first-three-month profit: $1,500–$2,500
These are source-provided examples, not guaranteed returns.
Scenario 2: You Already Sell on Poshmark
Recommended category: Clothing
You already have an audience, which can reduce the challenge of finding buyers.
Example budget: $1,000 per pallet
Source example first-three-month profit: $1,200–$2,000
Scenario 3: You Want the Highest Hourly Rate
Recommended category: Cosmetics
The source reports:
- $29–35/hour potential
- 7–14-day sell-through
- 100–168% margins
- $1,000–$1,500 pallet budget
However, cosmetics require greater attention to authenticity and product information.
Scenario 4: You Have Contractor Connections
Recommended category: Tools
Tools become particularly interesting when you can transition from individual retail sales into B2B wholesale.
The source reports potential hourly rates of $22–28/hour in retail and higher potential rates through wholesale relationships.
The Bottom Line: Which Liquidation Pallet Category Is Best?
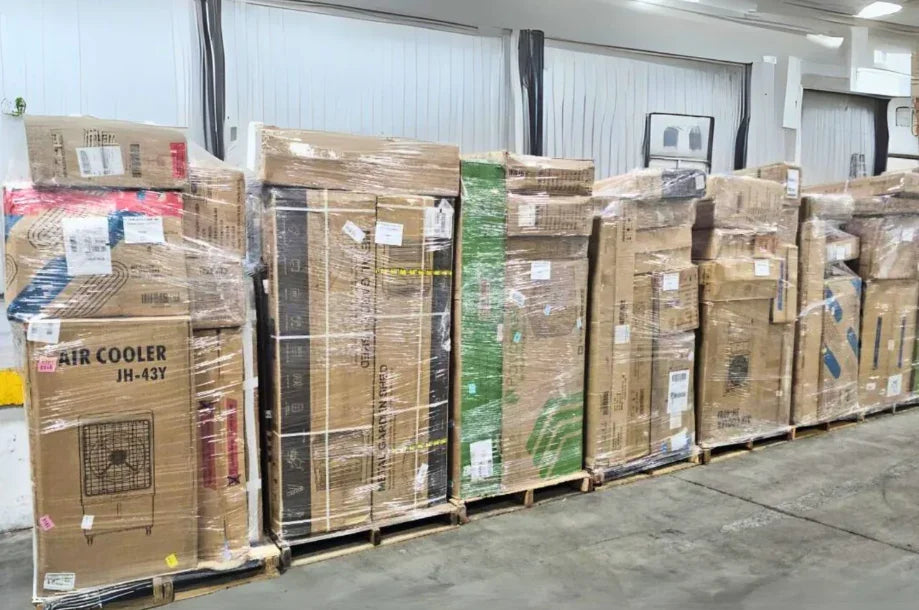
There is no single “best” option among all Liquidation Pallet Categories.
There’s only the category that best matches your business.
Based on the supplied data:
✅ Electronics = Strong hourly rate, balanced complexity, and fast potential capital turnover
✅ Tools = Lower complexity and strong wholesale potential
✅ Clothing = Highest visible margins but benefits from an established audience and efficient processing
✅ Cosmetics = Strong hourly potential but requires careful authenticity and compliance checks
The smartest strategy may be to start with one category, learn the process, track your results, and then diversify.
Month 1
Source one pallet, master one platform, and track every dollar and hour.
Months 2–3
Repeat your strongest category and consider introducing a secondary category such as clothing or tools.
Month 4+
Consider scaling to multiple pallets and developing relationships with repeat suppliers and wholesale customers.
Ready to Explore Liquidation Pallet Categories?
You now know how different Liquidation Pallet Categories compare based on:
- Profit margins
- Sell-through speed
- Hourly rate
- Capital requirements
- Complexity
- Risk
- Seasonal demand
- Resale platforms
Browse by Category
- Electronics Pallets — For electronics-focused resellers
- Tool Pallets — For contractors, local buyers, and wholesale opportunities
- Clothing Pallets — For fashion and apparel resellers
- Cosmetics Pallets — For beauty-focused resellers
You can also browse the full liquidation pallet selection and compare products based on category, price, condition, and available inventory.
Final Takeaway
Don’t automatically choose the category with the biggest advertised margin.
Instead, consider the complete picture:
Demand + Condition + Acquisition Cost + Selling Fees + Time + Sell-Through = Real Resale Opportunity
That’s the key to choosing the right Liquidation Pallet Categories for your business and building a resale operation based on realistic numbers rather than hype.